PROJECT AT A GLANCE
AV Social Strategies · Best Bounce Chicago
Scope
Measurement · Booking-system attribution · Google Ads · Seasonal budget planning
Period
April 2026 to October 2026
Tools
Google Ads, Google Tag Manager, GA4, Inflatable Office
01 / THE CHALLENGE
A flat business, and an ad account that could not see a booking.
AV Social Strategies is a Chicago agency offering UI/UX, development and SEO. I run paid media and measurement for its clients, including Best Bounce Chicago, an owner-run company renting bounce houses, water slides, obstacle courses and party equipment across Chicago’s southwest suburbs. Bookings run through Inflatable Office, the booking and CRM platform most US rental companies use.
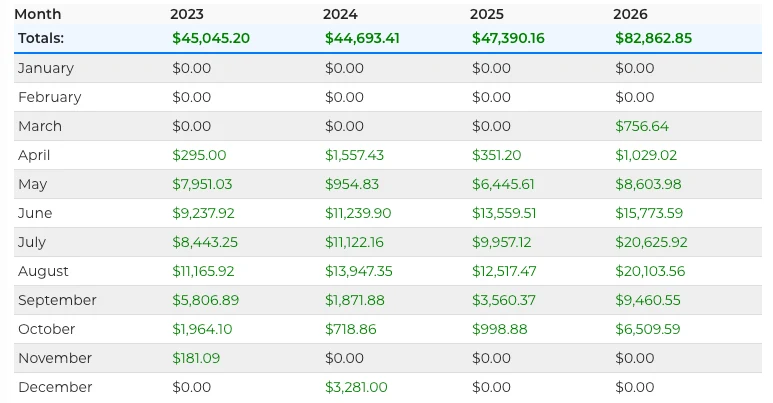
Sales had been flat for three seasons: $45,045 in 2023, $44,693 in 2024 and $47,390 in 2025, almost all of it between May and August.
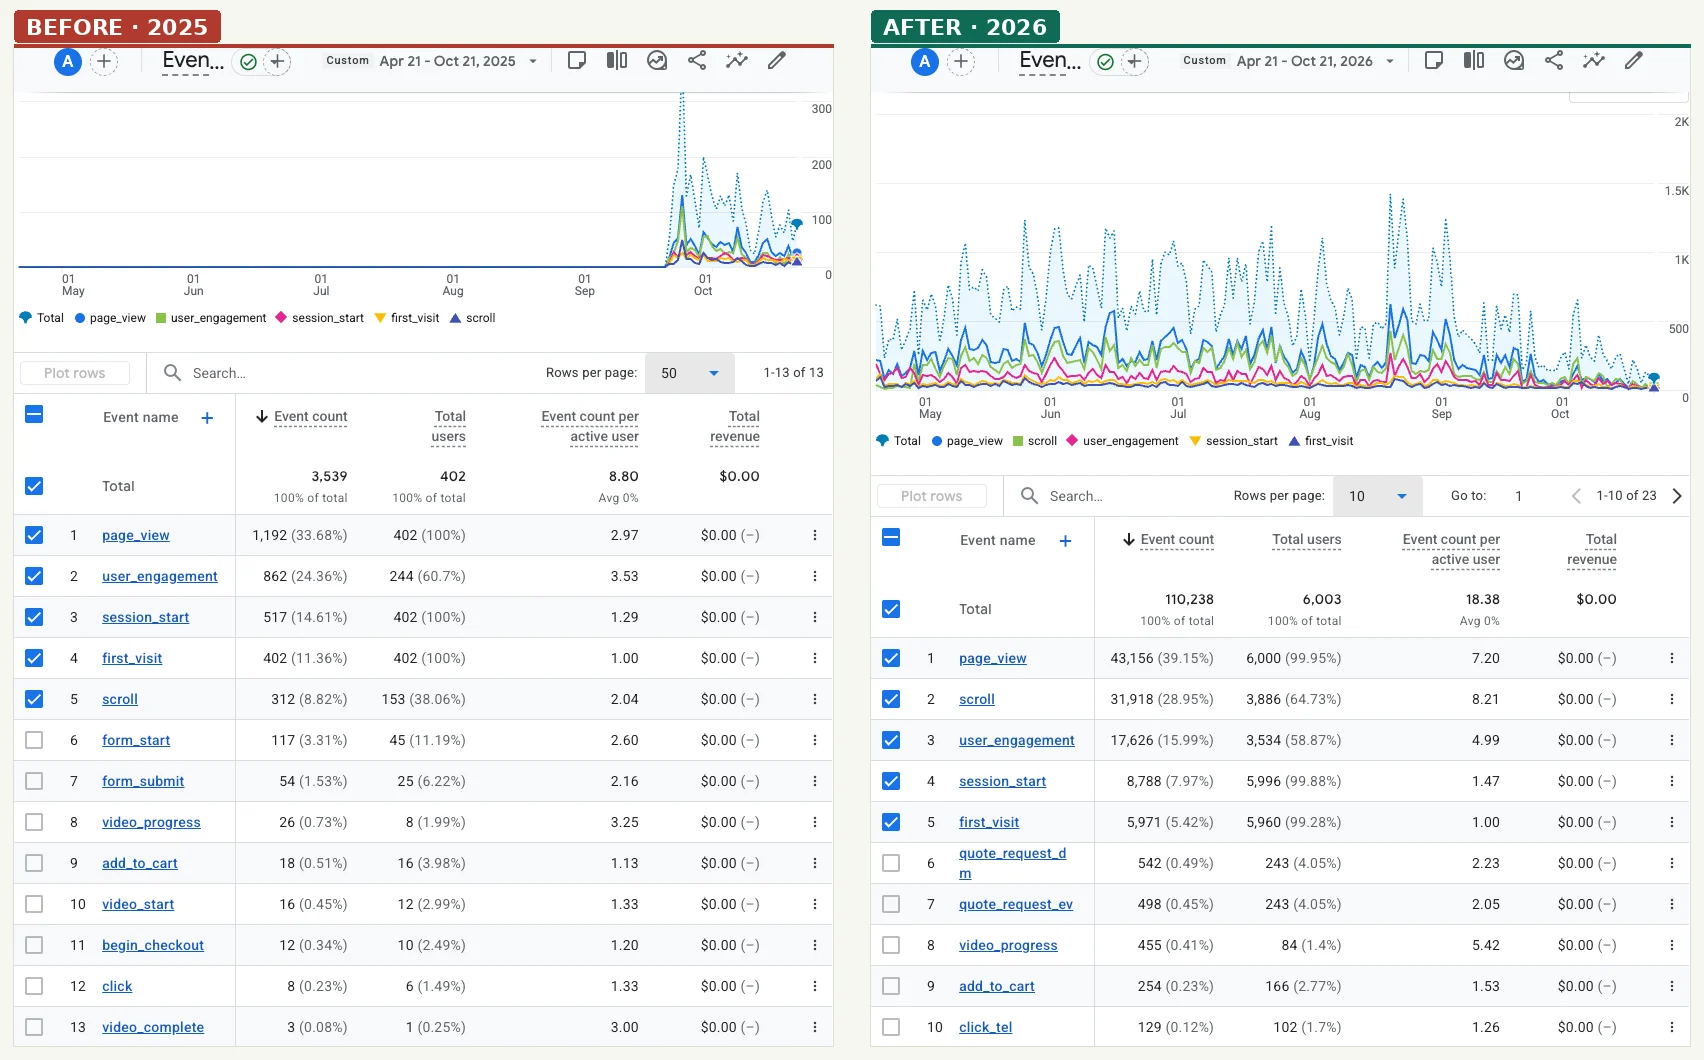
- No Tag Manager, no lead events. The site had no container. GA4 only started collecting in late September 2025, with automatic events and nothing for quotes or calls.
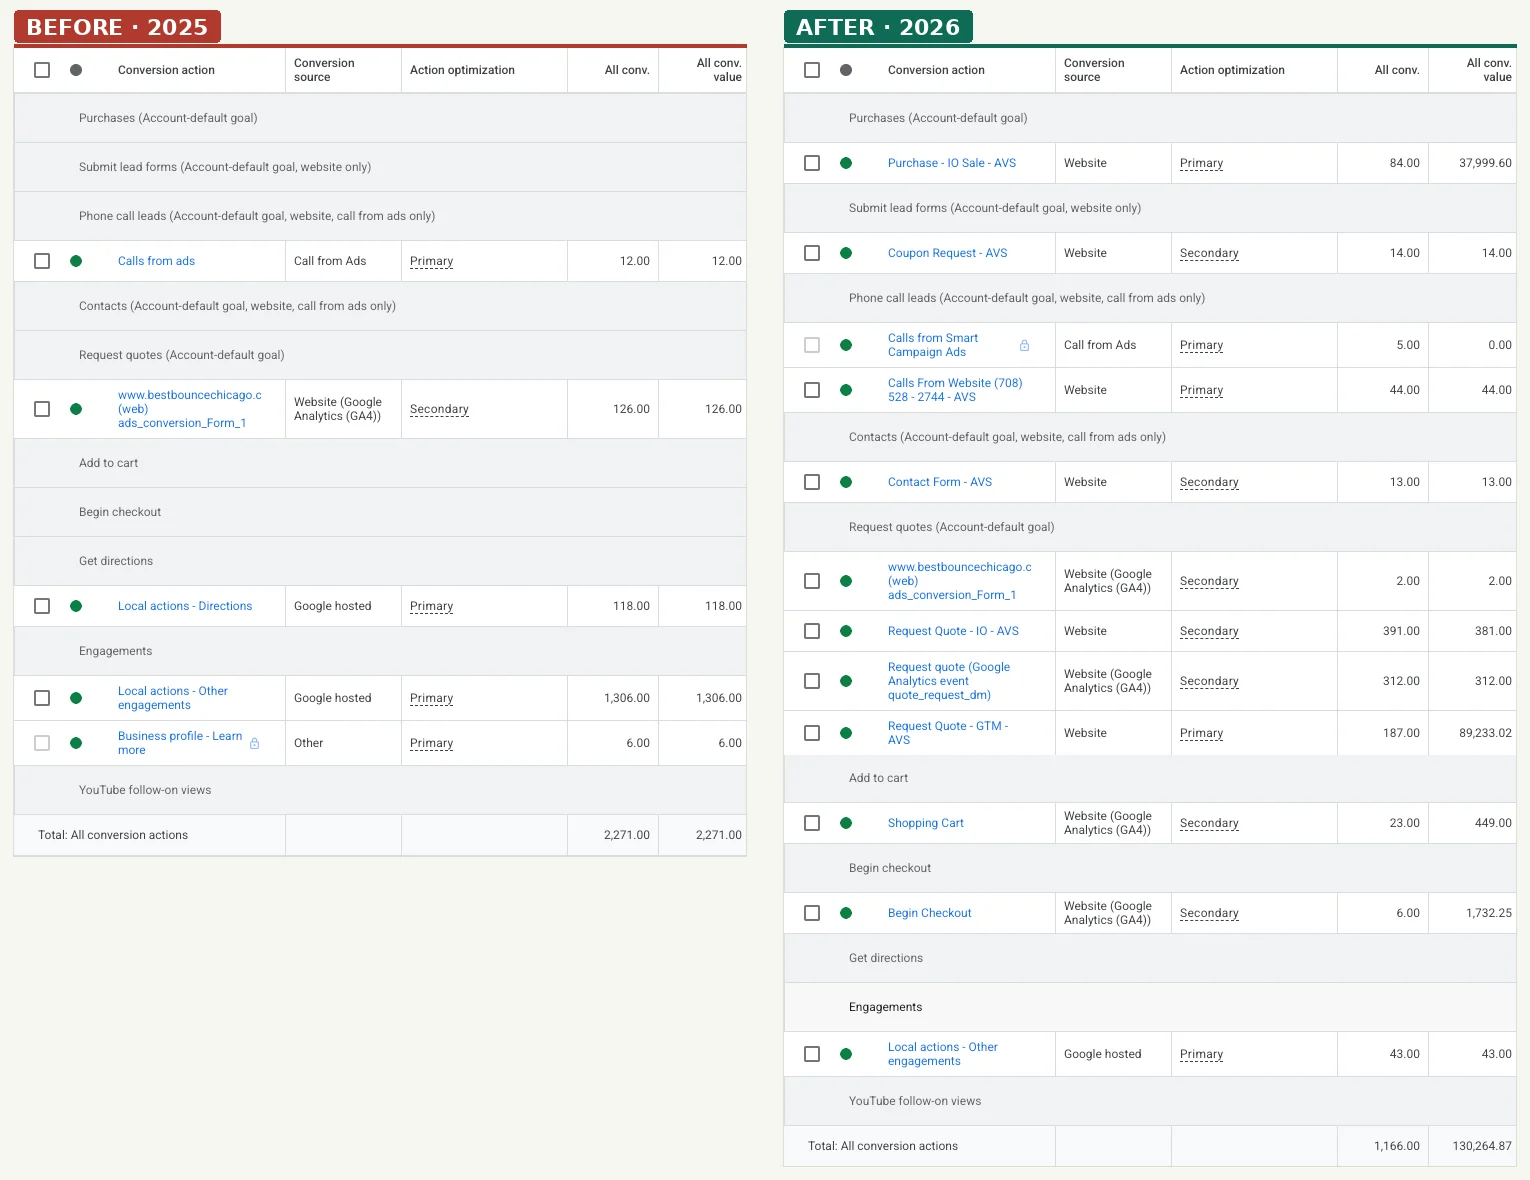
- Conversions that were not enquiries. Between April 21 and October 21, 2025 the account recorded 2,271 actions, 1,306 of them “other engagements” on the map listing and 118 direction requests. The Purchases goal was empty.
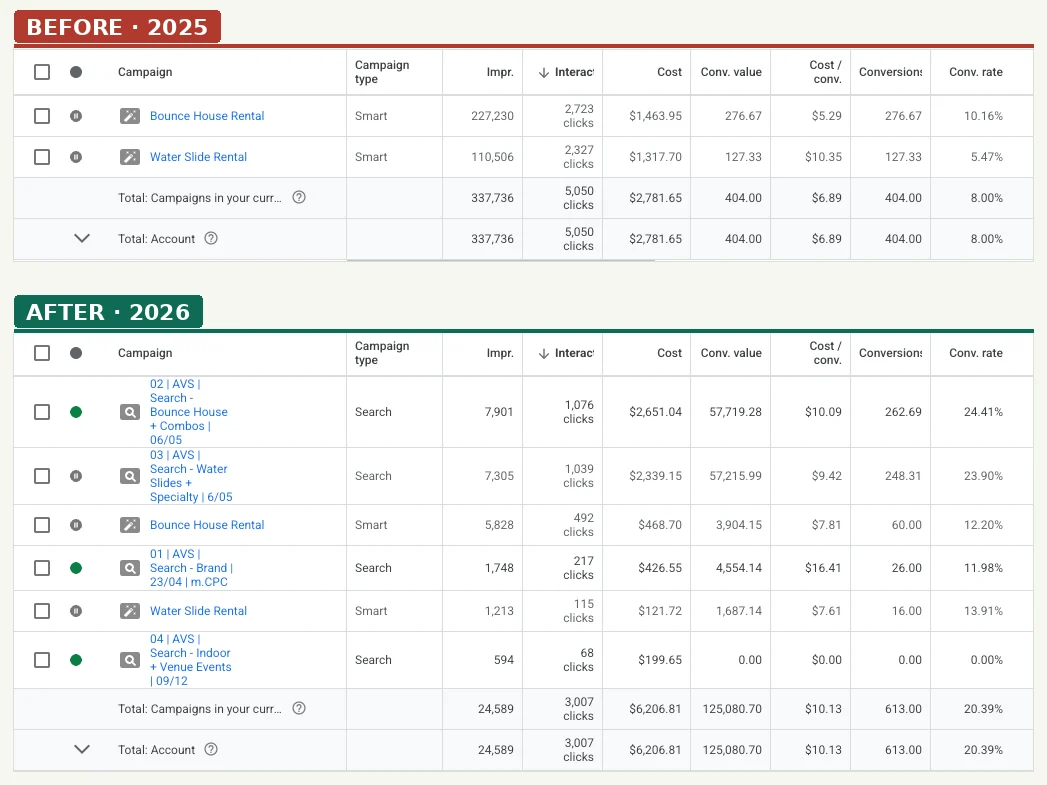
- No values. Every conversion counted as $1, so 404 campaign conversions were worth $404 and bidding could not tell a booking from a map click.
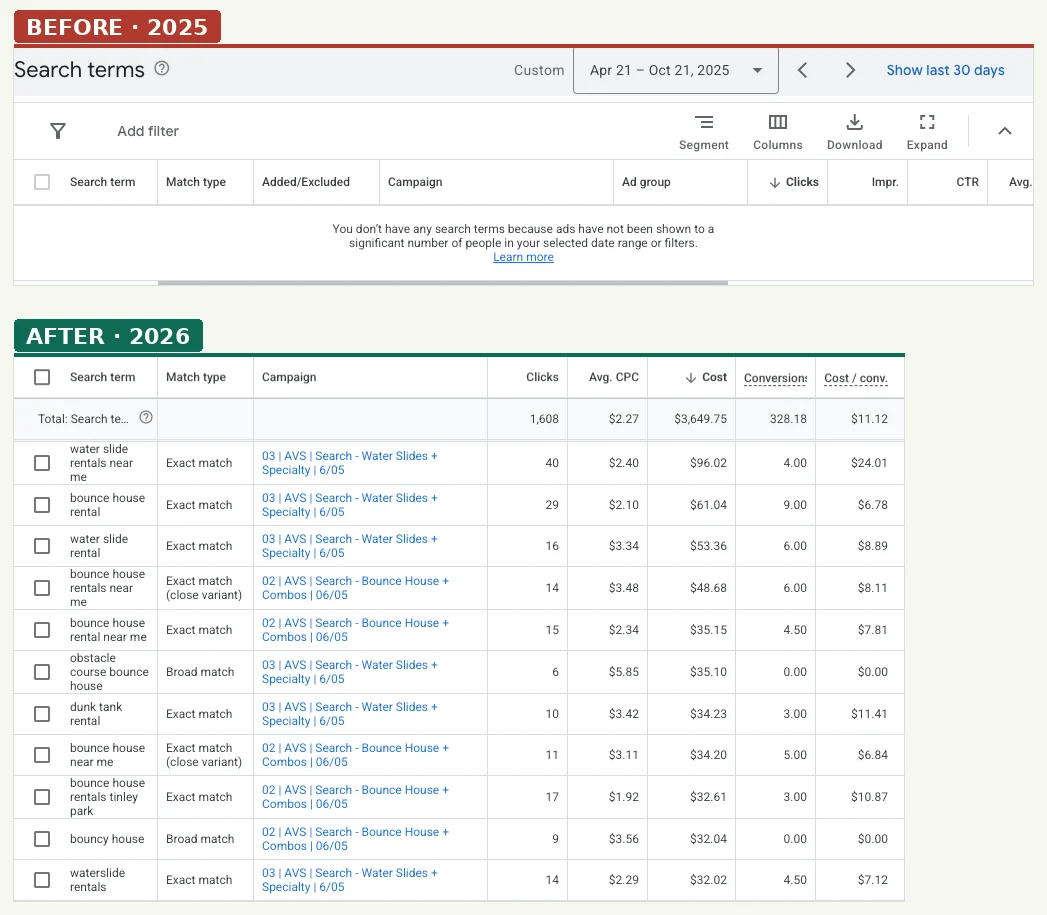
- Smart campaigns only. $2,782 ran through two Smart campaigns that show no search terms, so nobody could see what 5,050 paid clicks had searched for.
- The booking system could not see ads. Inflatable Office credited $0 of 2025 sales to Google Ads.
PART 1 · MEASUREMENT
02 / THE WORK
Build the measurement first.
Inflatable Office has no GA4 integration and limited room for custom code, so the tracking had to work with the platform rather than around it.
01
Create the container
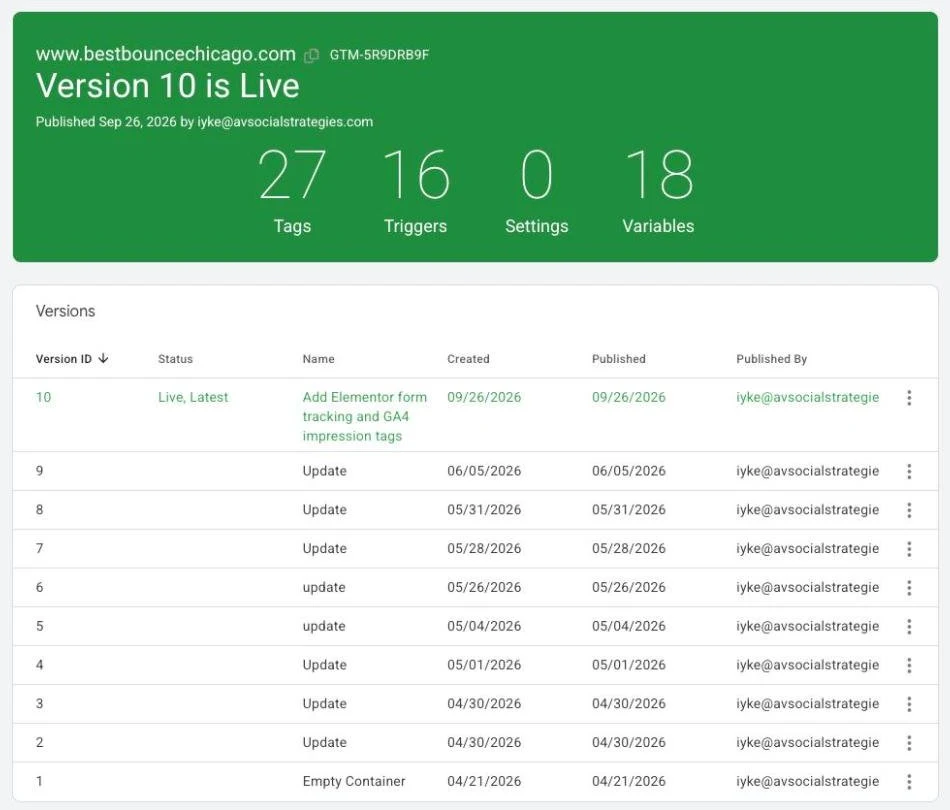
Created the site’s first Tag Manager container on April 21, 2026 and shipped 10 releases by September: 27 tags, 16 triggers and 18 variables.
02
Track inside the booking platform
Placed the Google Ads conversion tags in Inflatable Office’s own script holders and passed its lead ID and quote total into each one, so every quote and booking reaches Google Ads with its real value.
03
Give GA4 the same events
Quote requests with lead ID and quote value, completed bookings, coupon requests and phone clicks in GA4, then form-level tracking on the site’s Elementor forms in September.
04
Decide what counts
Set three primary conversions: valued quote requests, completed bookings and website calls. Map clicks, engagements and duplicate imports moved to secondary or out.
05
Check it against the booking system
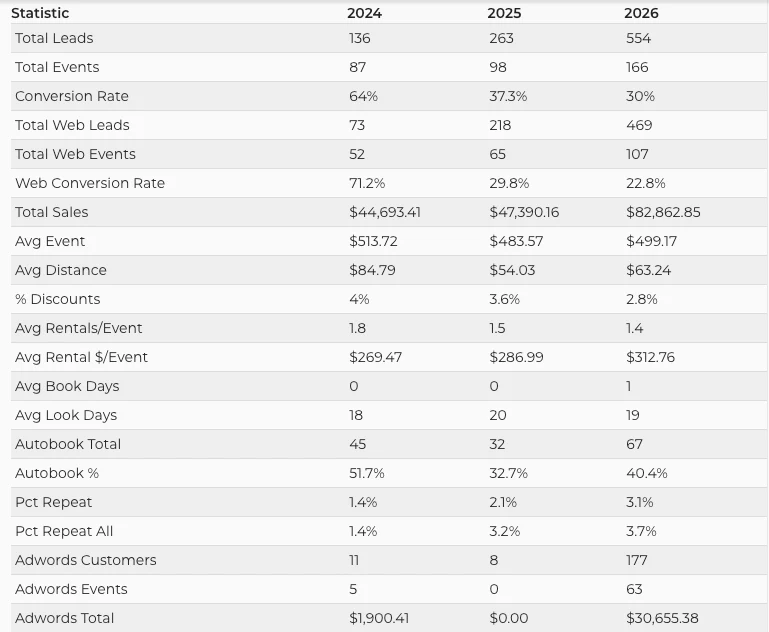
Compared Google Ads bookings with Inflatable Office records, which now show a Google Ads source on 177 customers and $30,655 of completed sales.
PART 2 · GOOGLE ADS
Then rebuild the account and move it with the season.
With valued conversions flowing, the Smart campaigns were replaced with Search campaigns I could see into and control.
01
Replace the Smart campaigns
Launched a Brand campaign on April 23, then Bounce House + Combos and Water Slides + Specialty on May 6, and paused the Smart campaigns. Bidding moved to target CPA and target ROAS once values were flowing.
02
Redeploy the budget, not cut it
In late August, 44% of spend was going to water slides just as their clicks became 48% more expensive and demand ended. I proposed keeping spend flat and moving it to bounce houses, combos and fall events. The owner approved it the same day.
03
Clean up brand
Four broad brand keywords had spent $130 in 90 days for zero conversions, including clicks on a competitor’s name, while the exact terms produced all 8 brand conversions on $16.77. Replacing them with one phrase keyword cut brand cost per lead from $24.70 to $10.09.
04
Test demand nobody had tested
Built an Indoor + Venue Events campaign for 20 southwest suburb towns from September 12. When the first 14 days brought play-centre searches, I added 15 negatives and the traffic turned to rental intent. The owner and I agreed a dated test to October 31, plus a direct outreach list of schools around his one repeat indoor client.
03 / THE OUTCOME
The best season in the company’s history.
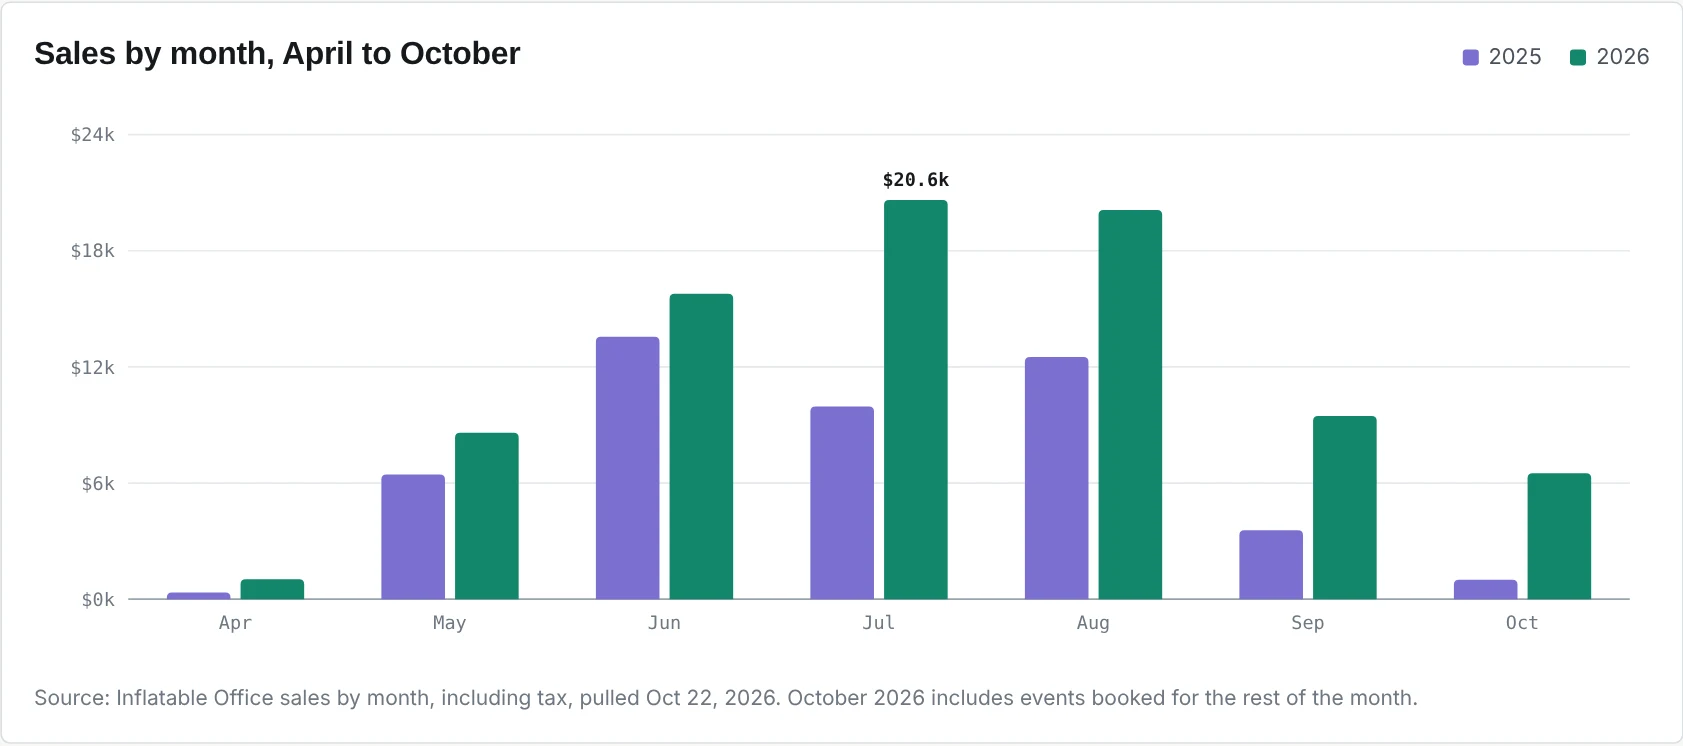
Every month from April to October 2026 beat the same month of the last three years. Sales passed the owner’s $80,000 “hopeful” goal by October 8, against $47,390 for all of 2025. The booking system credits $30,655 of completed 2026 sales to Google Ads, against $6,207 of ad spend in the same window.
Sales by month
October, when the season normally stopped because the ads were switched off, brought $6,510 against $999 in 2025.
| Month | 2025 | 2026 | Change |
|---|---|---|---|
| April | $351 | $1,029 | +193% |
| May | $6,446 | $8,604 | +33% |
| June | $13,560 | $15,774 | +16% |
| July | $9,957 | $20,626 | +107% |
| August | $12,517 | $20,104 | +61% |
| September | $3,560 | $9,461 | +166% |
| October | $999 | $6,510 | +552% |
| May to October | $47,039 | $81,077 | +72% |
Leads and lead value
Leads in the booking system more than doubled, from 263 in 2025 to 554 in 2026, and the average rental value per event rose from $287 to $313.
When water slide demand ended in September, leads fell 58% but each carried 40% more quote value ($374 against $267). New institutional customers appeared, among them a veterinary hospital, a dance studio and a memory-care home; five of the eight carried a Google Ads source in the booking system.
“Yes, my minimum goal was 60, 70 was my target, and 80 was hopeful. I’m definitely happy with the result, and it takes a lot of stress off my shoulders heading into winter knowing I can pay my bills.”
Joshua Holben, owner, Best Bounce Chicago · October 8, 2026
Timeline
| Date | Milestone |
|---|---|
| Apr 21, 2026 | Added to the account; Tag Manager container created |
| Apr 23 | Brand Search campaign launched |
| Apr 30 to Jun 5 | Eight tracking releases: quote requests, bookings, coupons and calls, each with lead ID and value |
| May 6 | Bounce House + Combos and Water Slides + Specialty launched; Smart campaigns paused |
| Jul 2026 | Best month in the company’s history: $20,626 |
| Aug 30 | Seasonal plan approved: redeploy the water slide budget, prepare fall |
| Sep 1 to 14 | Water slides wound down; brand cleanup; 45-term negative list; fall ad copy |
| Sep 12 | Indoor + Venue Events campaign launched |
| Sep 26 | Play-centre negatives added; form-level GA4 tracking released |
| Oct 8 | 2026 passes $80,000; fall test agreed through October 31 |
How the numbers were measured
- Sales come from Inflatable Office, the client’s booking system, and include tax. Organic search, reviews (126 by October) and a small Meta test grew alongside paid search; only the $30,655 with a Google Ads source is credited to ads.
- Google Ads conversion value includes quote requests, which are estimates until the event is booked. Completed bookings tracked in Google Ads total $38,000; that is the figure to compare with spend.
- All conv. in the conversion-action screenshots includes secondary actions, so it is higher than the Conversions column in the campaign screenshots.
- 2026 figures run to October 22, so year totals compare a partial 2026 with a full 2025.
Need the same clarity on your account?
Most of this work started with an audit of the tracking. If your reports disagree or your leads cannot be traced back to campaigns, that is where to start.